Thursday, October 27, 2022

YouTube rolling out profile handles


Over the next several weeks, YouTube channels will have a different, but an important, new look to them in hopes of creating a more connected network.

In an announcement, YouTube said, "over the coming weeks YouTube will be introducing handles to make it easier for members of the community to find and connect with each other. Your handle will be unique to your channel and will be how people mention you in comments, community posts, and more."

Handles are a part of several social media platforms, most notably with Twitter and Instagram. But they're also used on Facebook and TikTok, to name a few others. The purpose of handles on social media is to make it easier for users to connect content with each other such as shout-outs.

YouTube is contacting users via email notifying them of the change and the process on how users will be able to create their handles for their channels.

Here’s what you need to know, according to YouTube:

"We're gradually rolling out the ability to choose a handle for all channels over the coming weeks, and you will receive another email and a notification in YouTube Studio when you’re able to choose yours. In most cases, if you already have a personalized URL for your channel, we’ve reserved this for you as your handle. If you want a different handle from the one we’ve reserved, you can change it. If you don’t already have a personalized URL today, you’ll also be able to choose a handle for your channel.

"Starting on Nov. 14, 2022, if you haven’t yet selected a handle for your channel, YouTube will automatically assign you a handle, which you can change in YouTube Studio if you'd like."

Here are some additional resources to help prepare you for the change:

Q/A about YouTube handles

What will be different with YouTube handles

Thursday, September 8, 2022

Are you providing the best customer experience digitally?


In today's world, one that's heavily reliant on digital interaction, that is a very important question.

Now more than ever, marketers are looking for ways to create the best possible experience on a website across all sorts of devices, social media platforms, etc.

Because the industry ebbs and flows as demands change, it's hard to get a clear picture of what a customer wants when they're shopping online.

According to Forbes, ecommerce shopping has jumped 55% since the start of the pandemic (March 2020).

So, are you providing the best customer experience digitally?

A new report from Content Square called "Digital Experience Benchmark" offers 78 pages of in-depth data about customer experiences on websites across all types of devices, industries, etc.

Here are some highlights:

  • 85% of customers don't believe they have a positive online shopping experience.
  • 58% of total online traffic comes from mobile, but it's diminishing.
  • Users spend more time on a website on a desktop by almost 50% longer than on mobile.
  • 1 second delay loading page speed increases customer dissatisfaction by 16%.
  • 1 second delay loading page speed decrease conversion rate by 20%.
Read the full report by clicking here.

Wednesday, July 13, 2022

Changes announced for GA-4


Google, in a blog post, announced changes, introductions of new dimensions and metrics with Google Analytics 4.

"We're excited to release new dimensions and metrics, enabling you to see bounce rate, additional UTM parameter values, and conversion rate across various surfaces, including explorations, segments, audiences, reports, and the Google Analytics Data API," the post said.

Here's a breakdown of the changes, via Google.

Bounce rate

In Google Analytics 4, Bounce rate is the percentage of sessions that were not engaged sessions. In other words, Bounce rate is the inverse of Engagement rate, which is the number of engaged sessions divided by the total number of sessions in a specified time period.

Bounce rate is available in Explorations and Reporting Customization. This is a metric currently available in Universal Analytics (or GA-3).

Bounce rate is calculated in Google Analytics 4 in a different way from how it's calculated in Universal Analytics. To learn more about how the calculations are different between Universal Analytics and Google Analytics 4, see [UA→GA4] Comparing metrics: Google Analytics 4 vs Universal Analytics.

UTM term and UTM ad content

We've added new dimensions that surface the utm_content and utm_term parameter values in Explorations, Reporting, and the Audience Builder. Both parameters have a user-scoped and session-scoped dimension.

The following new dimensions enable you to see the value assigned to the utm_content parameter across user and session scopes:

  • First user manual ad content
  • Session manual ad content

Additionally, the following dimensions enable you to see the value assigned to the utm_term parameter across user and session scopes:

  • First user manual term
  • Session manual term

Conversion rate

The following new metrics let you report on the conversion rate for any conversion event:

  • User conversion rate is the percentage of users who triggered any conversion event.
  • Session conversion rate is the percentage of sessions in which any conversion event was triggered.

Remember. It is expected that Universal Analytics will be going away in July 2023. Click here to read more about the full-on switch to Google Analytics 4 or GA-4

Web design matters to SEO

When looking at a brand’s online presence, sure it’s important to be active and engaged on social media. But it’s just as important, if not more important, to make sure you have a highly functioning website.

I like to think of attracting leads, digitally, like this: social media is the outside facing of a company, business, etc. The website is what you see once you’re through the door from the outside.

Both need to make strong impressions. You need to capture their attention on social media. Then, you need to keep them “in the building” (or the website).

When considering a website’s functionality, navigation ease is an important part of it. But one area that is often overlooked and has high value as well is design.

Design matters.

And by design, it’s more than just easy-to-find call-to-actions. It also includes text size, colors, etc.

All of the above details matter when it comes to making a strong first impression to a user to your website, but also in terms of SEO results as well.

Let’s explore the key elements to an effective website, in this case, from a SEO results standpoint.


HEADLINES

There is a specific structure and flow you should follow when designing a website. It’s not only helpful for the users, but also for web search crawling tools as well.

Search engines, as well as human users, use headings to crawl through websites to understand the site’s content. Once a search engine understands the content, it better understands where and when to rank your site in search results.

Each page should have a single H1 and subheads in a sequential, descending order that doesn’t skip any levels.

For each headline after an H1 headline (sometimes seen as Headline1 in some templates), follow a hierarchy (H2, H3, H4 and so on). If you need to use subheads, use a paragraph-type text style.

Something else to consider, H1 headlines need to be short and clear. The further down you go in the headline hierarchy, the longer a headline can be.

PRIORITIZE WEB DESIGN FOR MOBILE OVER DESKTOP

According to Statista, the latest number of smartphone users in the world today (as of July 2022) is 6.6 billion, or 83.7% of the world's population.

Because of that, mobile-friendly websites are highly valued in SEO. Search engines can detect mobile devices, and they assign better results to websites that are mobile friendly over ones that aren’t.

Make sure your website automatically responds and adjusts to screen size and not make it reliant on the user to do it. That’s a negative experience and likely a lead lost.

Another thing to consider: videos.

Videos on desktop sites often look nice and add spice to a website. Given screen sizes with mobile devices, that same video likely won’t look as good on mobile. In addition, video slows down website loading speed, which diminishes not only SEO results, but also user-friendly navigation.

BE AWARE OF SITE LOADING SPEED

Page speed is considered one of the leading SEO ranking factors. Impatient users expect websites to load within seconds. Improve speed by contracting with a good host and enabling browser caching.

What also slows a site’s loading speed includes the previously mentioned videos component, large images and colors. A sharp-looking desktop site with all sorts of graphics and animations may look great and appealing on a desktop, but that may not transfer to the mobile site.

I often recommend, the simpler the design the better.

KNOW WHY USERS GO TO YOUR SITE

Sounds obvious, right? But it shouldn’t be overlooked.

Earlier, I talked about the key to a first impression. Attracting the users quickly and then holding them can also improve or diminish SEO results. Say if you are in the top spot on the SERP (search engine results page), that’s great. But, if the user immediately clicks back to the SERP and clicks a different link, that sends a trigger to search engines that the previous result didn’t apply to them. If those build, that’ll hurt SEO result.

IN SUMMARY

A visually pleasing website promotes users’ confidence in your brand, which causes them to stay on your site longer, which then improves your SEO results. Place high value on web-friendly images, a text hierarchy and simple graphic elements (such as video), and SEO results will improve.

One last point, always be sure your meta descriptions are up to date and accurate. Also include these on images and videos, if possible.

TikTok in U.S. has unclear future


Could TikTok be in for another legal challenge in order to remain in operation in the US?

Read more from socialmediatoday.com, by clicking here.

Tuesday, June 28, 2022

LinkedIn enhancing engagement options


LinkedIn is looking to build on its record levels of engagement by enhancing the engagement options on its platform.

Among those enhancements are new comment and comment reply options on Event pages, and a ‘Repost’ option.

It was reported by LinkedIn in April that the company continues to see record levels of engagement, which led to a 34 percent increase in revenue in the first quarter.

In respect to Event comments, LinkedIn is rolling out more comment engagement options within LinkedIn Events. The goal is to encourage on-topic discussion and engagement at events. According to socialmediatoday.com, "The option is designed to capitalize on LinkedIn Events engagement, with more than 24,000 events now being created in the app every week. LinkedIn also recently expanded its streamlined ‘Boost’ ad option to incorporate LinkedIn Events, providing users with another way to amplify their LinkedIn event listings. It could be a good way to both encourage topical discussion, while also promoting your event."

As far as the repost option, the goal here for LinkedIn is make it easier to amplify job opportunities, while also streamlining engagement by reducing some of the steps to add commentary to every re-share.

YouTube publishes Culture & Trends report


YouTube has published its "Culture and Trends" report, which includes insights from 10 countries to provide perspective on what’s driving the latest video trends, and how that can relate to businesses digital marketing strategies.

The report looks at three trends: Community Creativity, Multi-format Creativity and Responsive Creativity.

In its introduction, YouTube says, "The pop culture landscape was varied, and a new type of online video creator was rising in prominence, but everyone experienced digital culture in basically the same way.

"Now, pop culture is all about you. We still have viral videos, but single videos are comparatively less likely to achieve broad cultural breakthrough."

According to YouTube, new video formats and technologies have grown massively in the last five years. It said 85 percent of Gen Z users have posted video content online. Gen Z is defined as someone born between 1981 and 1996 (or people from ages 26-41 in 2022).

YouTube also acknowledge the COVID-19 pandemic has "reshaped our relationship with video and accelerated a number of long-term trends."

Here is some data to consider:

  • 65 percent of Gen Z agree that content that's personally relevant to them is more important than the content that lots of other people are talking about.
  • 55 percent of Gen Z agree that they watch content that no one they know personally is interested in.
  • 63 percent of Gen Z followed one or more meme accounts in the past 12 months. "Producing and consuming remixable content - often as memes - is a major way that Gen Z and millennials participate in pop culture," the report said.
  • 57 percent of Gen Z agree that they like it when brands participate in memes.
  • 59 percent of Gen z agree that they use short-form video apps to discover things that they then watch longer versions of.
  • 69 percent of Gen z agree that they often find themselves return to creators or content that feels comforting to them.

Why are you dropping in SEO results?


Don't get discouraged. Mastering SEO is a hard thing to do. There is so much competition for top-of-the-results placement. But, you also know there are ways to standout. Among those, is making sure your website content is updated and making Google Business Profile is updated are two of the easiest suggestions.

But, because SEO placement ebbs and flows, one day you're high on the results, say in that 0, 1 or 2 position. Then, the next week, you're out of those spots. It happens.

Then of course the question you ask is why did that happen?

Here are some possible reasons:

  • Technical issue with website. Possibilities here include any change(s) of URL(s), any recent updates (such as uploading a photo or photos and/or video or videos) that slowed the speed of the site, or any updates in general (maybe something as simple as changing the layout or template) been made that could again slow website loading speed. Several research studies have shown that slow website loading speed not only hurts the ability to track consumers but also has a factor in SEO results. The quicker a site can load, the better. You typically have less than a matter of seconds to get your site loaded before a user will click away.
    • Another thing to consider is your CLS. Color changes can hinder website performance as well.
  • Ah the ol' algorithm by Google. Google is CONSTANTLY working on keeping its algorithm up to date, specifically making sure users are getting search results relevant to them. One of the top factors in that is localization. Google continually puts a greater emphasis on presenting results to users that are of local interest to them.
  • Competition. This has already been mentioned, but bears repeating. Competition is a big factor in search results, especially local ones. Continue to monitor what your competition is doing.
  • Link building. If you've changed URLs, that'll means lost links on third-party websites. For example, if you have a URL listed on a Chamber of Commerce page, you need to make sure when you update the URL, that the change is also reflected on the Chamber of Commerce. When you lose a link, you lose some link credibility and accuracy, and those elements can lead to lower website scores.
  • Keyword search demand. This can fall into the competition category as well. Not only are you competing with other businesses, but also you're competing for keywords. If you're business' or organization's industry is suddenly in high demand, there's heavy competition there too.
Here are some tips and tools on how to address lags in your search result placement:
  • Meta tags and descriptions. Continue to make sure these are accurate and up to date. Make any changes when necessary.
  • Sitemap. Make sure your sitemap is updated and accurate with Google. You can do this through Google Search Console.
  • Site speed. Check on your website's speed. Google has a free tool for you to check that called PageSpeed Insights.
  • Test your site's SEO. There are several resources for that including Sitechecker and Google SERP Snippet Optimization Tool, to name a few.

Thursday, May 19, 2022

Meta/Facebook releases 'Widely Viewed Content' report

Meta/Facebook has published its "Widely Viewed Content Report," which highlights the most-viewed organic content in Facebook feeds by U.S.-based users throughout the first quarter of 2022.

According to socialmediatoday.com, "Meta came up with the report to counter the narrative that its algorithms help to amplify right-wing and extremist content." Socialmediatoday.com added this was a response to a Twitter profile that "highlights the most shared Facebook links each day, and has been widely quoted in such criticism." The Twitter profile is @FacebooksTop10.

Meta/Facebook has created a center within its company website called Transparency Center.

Here is a brief description of that center:

"Since 2016, we've used a strategy called "remove, reduce, inform" to manage content across Meta technologies.

"This means we remove harmful content that goes against our policies, reduce the distribution of problematic content that doesn’t violate our policies, and inform people with additional context so they can decide what to click, read or share.

"To help with this strategy, we have policies that describe what is and isn’t allowed on our technologies. Our teams work together to develop our policies and enforce them."

In Q1 2022, Meta/Facebook reported 85.3% of views came from posts shared by people’s friends, from Groups people had joined, or Pages they had followed. Of the remaining 14.7% of Feed content views in the U.S. during Q1 2022, 11.7% came from in Feed recommendations, which show people content from sources they are not connected to, but Meta thinks users might be interested in. The company refers to this content as ‘unconnected posts’. The last 3% came from less common products, such as Events, and logging discrepancies.


Meta reported youtube.com had the most content viewers at 182.3 million. TikTok.com was next at 135.4M, gofundme.com (123M), amazon.com (122.8M) and media1.tenor.co (119M). The rest of the top 10 was twitter.com (118.8M), linktr.ee (92M), open.spotify.com (91.1M), dailymail.co.uk (88.3M) and eventbrite.com (82.5M).

Google unveils changes to maps, search insights

At its 2022 I/O Summit, Google announced a range of updates and new features related to the presentation of its Map app as well as search insights.

In a jaw-dropping development, Google unveiled what it is calling an Immersive View to the Maps app.


"Today at Google I/O, we announced new ways the latest advancements in AI are transforming Google Maps — helping you explore with an all-new immersive view of the world, find the most fuel-efficient route, and use the magic of Live View in your favorite third-party apps," said Google in a blog post.

In short, the Maps updates will enable users to experience what a neighborhood, landmark, restaurant or popular venue looks like, via your device.

"With our new immersive view, you’ll be able to experience what a neighborhood, landmark, restaurant or popular venue is like — and even feel like you’re right there before you ever set foot inside," Google said. "So whether you’re traveling somewhere new or scoping out hidden local gems, immersive view will help you make the most informed decisions before you go."

Google said the Immerse View will work on just about any phone and device. The plan is to roll out the feature in Los Angeles, London, New York, San Francisco and Tokyo as 2022 progress. More cities will be rolled out soon after.

Google is also making steps to allow users to remove search results about them that includes personal information. Related to that, Google also announced it expanded its appeals process for the removal of search listings that include personal information.

On the advertising front, Google’s testing a carousel ad format in Search results. The goal will be to provide another way for shoppers to browse directly from the SERP.

In another ads-related announcement, Google also unveiled a new ads control dashboard, which will enable users to control how their ad experiences are personalized across Google’s apps and sites. The dashboard, which will be accessible on all Google ads, will enable users to like, share or block any ad, and/or show additional insight into who paid for the ad, and why they, specifically were targeted within that campaign.

Tapping on ‘Customize more of the ads you see’ will take users to a second screen above, which provides more controls over one's Google ad experience.

Users will also be able to limit ads relating to sensitive topics, including alcohol, gambling, dating, pregnancy, parenting, and weight loss.

Monday, May 9, 2022

Local SEO tips, why are they important


The competition is fierce to be discovered on the internet. Thus, the value of a sound SEO strategy is important to a company/business' success or lack of it.

WebFX has a blog post about important statistics to know when it comes to SEO and understanding its value. (WebFX does offer a free SEO calculator. You can view it here). Here are a few of those:
  • 80% of local searches convert.
  • 46% of Google searches are for local businesses.
  • The search term "near me" has increased more than 500% in the last few years (which puts a heavy emphasis on local searching).
  • 78% of people search for local businesses more than once per week.
  • 97% of search engine users search online to find a local business.
So how do you become successful on local SEO?

The first part is to understand that success in SEO doesn't happen overnight. It takes time to develop and populate, and really establish yourself as a business on the web. You have to gain Google's trust that you're a viable business with something to offer before it offers you to the masses.

Here are tips that can help with that.
  • Make sure you have a Google Business Profile (formerly called Google My Business). You can do that by clicking here if you don't have one set up. It's free.
    • Why? If a user does a search in Google, especially a local one such as looking for closest seafood restaurant, the most common result is called the Map Pack. It shows locations of seafood restaurants. Then if user clicks on the restaurant, they're shown the business profile, which contains things like website, phone number, reviews, photos, etc. Think of it this way: the map pack result or Google Business Profile is what a user sees from the street. The business website is for when the user wants to be inside the business. 
  • Get reviews of your business. This is a great thing to have, but can get complicated. Google has several mechanisms in place that try to sniff out what it believes is spammy-like reviews. It also looks to make sure reviews aren't being posted by one single email address or from the same IP address. Encourage visitors to your business to leave a review.
  • Optimize your website. Make sure you have a solid website. By that I mean have relevant content on the page. It can be a simple website. You don't need all the videos and graphics. That just hurts website loading speed, which is a factor in SEO. Understand what words or phrases users might use to try and find your business and make sure they're in prominent spots on your website, such as page titles.
  • Have clean and concise calls to action, contact page. When a user is on your site, make sure what you want them to do is clear and obvious. You typically have only a matter of seconds before someone makes a decision of whether to do business with you. Make those seconds count.
  • Utilize free analytics tools such as Google Analytics, Search Console and Data Studio. These tools offer tons of information to help you understand users' behavior on your site, but also how they're getting to your site. You can set up a Google Analytics account by clicking here.
  • Build backlinks. Get your site listed on important websites, such as local chamber of commerce, Better Business Bureau. Building backlinks ups SEO score, which improves SEO result.

Report shows teens still engaging with Facebook


Hootsuite has released a report that has several key findings, including what people are doing on specific social media platforms and teenagers still engage with Facebook.

The report entitled "Digital Statshot April 2022" explores data of social media users from 230 counties and territories. It's a 300-page document, but Hootsuite was kind of to break it down into a 29-page "Top Takeways" document, which you can view by clicking here.

Here are what I thought were the key takeaways of the top takeaways:

  • It was a breakdown of what type of content users are looking for on specific platforms.
    • 77.4% of users on TikTok are looking for funny/entertaining content, followed by Instagram (61.3%), Facebook (55.8%), Reddit (37.8%).
    • 62.2% of users looking to follow or research brands/products are doing so on Instagram, followed by Facebook (55.6%) and Pinterest (37.9%).
    • 59.8% of users looking to keep up to date with news/current events are doing so on Facebook, followed very closely by Twitter (59.7%). Instagram is third at 51.2%.
    • 71.1% of users looking to message and friends are using Facebook to do that. 49.9% use Instagram, 34.3% use Snapchat and 20.9% use Twitter, all the others were below 20%.
    • 69.9% of users posting or sharing photos/videos are using Instagram, then Facebook (64.3%). From there it drops to 40.3% on Snapchat and 33.9% on TikTok (thought this number would be higher.
  • Snapchat added 32 million users to its global ad audience over the past three months, a growth of almost 6% from quarter-over-quarter.
  • The Facebook advertising audience profile, the data says, is 17.8% 25-34 year old men, followed by 18-24 year old men (13.2%) and 25-34 year old women (12.2%).
  • Teenagers are still going to Facebook. Data says the platform added 2.8 million additional teenagers since the start of the year.
This next part was a bit shocking for me.

Hootsuite broke down communication channels used for work. The results showed the percentage of working professionals (ages 16-64) who use each tool or medium for work-related communication.
  • Phone calls was the leader at 77.3% daily, 95.1% overall. Email was close behind at 76.7% and 94.7%, respectively.
  • Office software such as Google Docs, Microsoft Office was 72.8% and 90.6%.
  • Messenger services such as Skype was 70.0% and 86.8%.
  • Video calls was 55.5%, 86.5%.


Monday, May 2, 2022

Facebook user growth back on track; revenue declines


After reporting a decline in user growth for the first time in its history, Facebook/Meta reported in its latest quarterly report that user growth grew in the first quarter of 2022.

In its 2021 Q4 report, the company reported it showed a rise in monthly active users and a growth in revenue. However, daily active users declined, losing about a million DAUs.

In the 2022 Q1 report, the DAUs was up to 1.96 billion from 1.929 billion. In the 2021 Q1 report, DAU was 1.878 billion. DAU reached 1.93 billion in Q3 2021 before the drop in the fourth quarter. It was an alarming revelation and it opened up perception as to whether the social media giant had reached its peak.

When looking at monthly active users, that data continues to grow.

In 2021 Q4, MAUs was 2.912 billion. In 2022 Q1, MAU was 2.936 billion.

While it appears users are sticking with Facebook/Meta, the company also revealed in its 2022 Q1 report that revenue declined.

In an article by zdnet.com, Facebook/Meta estimated Apple's iOS changes, including the mail privacy protection, will cost the company about $10 billion in 2022. The first report appears to validate that predication.

In Q1 2022, Facebook/Meta's revenue by user geography was $27,908 (in millions), down from $33,671 (in millions) from Q4 2021. Plus, net income in Q4 2021 was $10,285 (in millions) and dropped to $7,465 (in millions) for Q1 2022.

If you'd like to see the full earning report, you can view it by clicking here.

Friday, April 29, 2022

More on social media trends: What you need to know


As social media marketers, we always have to stay on top of latest trends, right? Introducing the latest social media report: "Social Media in the US" by GWI.

The report analyzes the latest social media trends in the United States. You can view the full report by clicking here.

To obtain the information, GWI said "Figures in this report are drawn from GWI’s online research among internet users aged 16-64. Please note that we only interview respondents aged 16-64 and our figures are representative of the online populations of each market, not its total population."

The sample size drew "insights from GWI’s Q3 2021 wave of research across 47 countries, with a US sample of 24,692 respondents."

Here are the key insights in the report:
  • Social engagement is waving. The report from Q1 2021 showed the highest average figures on record for US social media usage. "While engagement has plateaued for younger consumers, our latest Q4 data shows older consumers have kept social media in favor."
  • More TikTokers are scrolling away. "Since Q4 2020, the number of consumers using TikTok monthly has grown by nearly 50%. Despite its youthful reputation, engagement has grown most among Gen X (+79%) and baby boomers (+147%). Its popularity doesn’t show any signs of slowing and older consumers will have a leading role.
  • New contenders in the messaging space. "Data privacy is a growing focus, with increasing use of privacy-centered DuckDuckGo and encrypted messaging services. With WhatsApp growing in the last year, and Discord and Telegram making big leaps, their engaged messaging communities are a strong option for marketers.
  • Stories provide growing interaction opportunities. "While less stories are being posted, the number of consumers swiping up on Instagram stories is on the rise, and Facebook too. With significant growth among Gen X (+24%) and baby boomers (+33%) on Facebook Marketplace/Instagram Shopping, utilizing the latest story tools will help keep platform users engaged.
  • Social commerce is on the rise.
Let's take a deeper look into the data.

According to the report, Americans spend an average of 11 minutes less per day on social media than the global average. Users from the Middle East, Africa and Latin America are the most engaging areas.

Americans average about 2 hours, 18 minutes per day on social media. Globally that average is 2:29. Latin America, as well as Middle East/Africa are at 3:34. Europe is the lowest at 2:05.

The most popular social media platform for all those regions is Facebook/Meta. In addition, more than 2 in 5 social media users have at least five social media services.

During the pandemic, social media saw record-breaking engagement levels. As the pandemic has faded, so has engagement for at least some parts of the population, according to the report. For example, GenZ users (those born between 1997 and 2012) have gone from an average of 3 hours, 16 minutes on social media in Q4 2020 to 3:11 in Q4 2021. On the other hand, millennials, Gen-X and baby boomers also had higher engagement in Q4 2021 compared to Q4 2020. Millennials peaked at 2:47 in Q1 2021. That is now 2:42.

As for what apps appeals to what population segments, Instagram, Snapchat and TikTok reign supreme for Gen-Zers. Even Twitter is the most popular app for that age group. Facebook remains popular for those older than 25. LinkedIn is popular for those 25-54.

We've learned TikTok's short-form video model has reset the foundation for what's popular and how to be popular on social media. TikTok has expanded the video uploading options to be as long as 3 minutes. But, data shows there is still some value for videos lasting longer than 4 minutes.

LinkedIn reports growth, record engagement


Microsoft Corp., which owns LinkedIn, announced April 26 its third quarter results.

In the midst of the results report was an update on LinkedIn and the company shared positive results from its third quarter, which ended March 31.

LinkedIn revenue grew 34 percent. The growth, according to the report, was "driven by a strong job market in our Talent Solutions business and strong advertising demand in our Marketing Solutions business."

In addition, LinkedIn sessions grew 22 percent with record engagement.

“Going forward, digital technology will be the key input that powers the world’s economic output,” said Satya Nadella, chairman and chief executive officer of Microsoft, in a press release. “Across the tech stack, we are expanding our opportunity and taking share as we help customers differentiate, build resilience, and do more with less.”

Microsoft didn't release specific information about LinkedIn members, which, at last check, was at 810 million.

LinkedIn has launched new analytics, updates to profile video features and a subscribe bell and enabled creators to feature newsletters on their profiles, as well as a skills-first tool to focus on hiring and developing talent.

If you'd like to dive into more of Microsoft's/LinkedIn's latest report, you can click here.

Tuesday, April 19, 2022

New report tackles social media metrics


How many times has this question been asked: When is the best time to post on social media? If anyone knows the concrete answer, you'll likely be deemed a hero.

For many years as social media evolves, the answer that question becomes more complicated. How do you get an understanding of the behavior of more than 4 billion social media users?

There's no doubt that the pandemic shifted how social media is used and consumed. A report by Sprout Social said 71% of consumers found themselves using social more than they have in years past.

Sprout Social also broke that down by generations:

  • 78% increase by Generation Z (born between 1997-2012).
  • 77% increase by Millennials (born between 1981-1996).
  • 75% increase by Generation X (born between 1965-1980).
  • 54% increase by Baby Boomers (born between 1955-1964).
In short, consumers are on social media, despite the negative press it's gotten over the years.

In a new report by Sprout Social, it takes another swing at understanding best days/times to post on social media by platform. (You can view full report here)

According to Sprout Social, "We worked closely with our data science team to review findings and trends in social media usage over the past year from Sprout Social’s more than 30,000 customers and understand when their content was most and least frequently engaged with, broken out by platform and industry."

Here is the report broken down:
  • Best time to post on social media overall
    • Best times to post on social media overall: Tuesdays through Thursdays at 9 a.m. or 10 a.m.
    • Best times to post on social media: Tuesdays through Thursdays.
    • Worst days to post on social media: Sundays.
  • Best times to post on Facebook/Meta
    • Best times to post on Facebook: Mondays through Fridays at 3 a.m., Tuesdays at 10 a.m. and noon.
    • Best days to post on Facebook: Tuesdays through Fridays.
    • Worst days to post on Facebook: Saturdays.
  • Best times to post on Instagram
    • Best times to post on Instagram: Mondays at 11 a.m., Tuesdays and Wednesdays from 10 a.m.-1 p.m., and Thursdays and Fridays at 10 a.m. and 11 a.m.
    • Best days to post on Instagram: Tuesdays and Wednesdays.
    • Worst days to post on Instagram: Sundays.
  • Best times to post on Twitter
    • Best times to post on Twitter: Mondays, Tuesdays, Wednesdays, Fridays and Saturdays at 9 a.m.
    • Best days to post on Twitter: Tuesdays and Wednesdays.
    • Worst days to post on Twitter: Sundays.
  • Best times to post on LinkedIn
    • Best times to post on LinkedIn: Tuesdays 10 a.m.-noon.
    • Best days to post on LinkedIn: Wednesdays and Thursdays.
    • Worst days to post on LinkedIn: Saturdays and Sundays.

Understanding email in post MPP


For many years, the data to understanding email success was simple and easy to obtain. One of the core metrics that was seemingly the basis of email success evaluation was open rate. Simply if an email was opened by a recipient, it told you that someone was compelled enough to investigate further. Sounds like a success right?

For the most part, yes. But, that's the old way.

In September 2021, Apple rolled out the Mail Privacy Protection tool. In short, when an email is sent from an ESP or an email service provider, Apple will open the email, masks identifying characteristics of the recipient and then send the email to the inbox.

Since this adoption, the long relied upon metric, the open rate, has suddenly grown to be irrelevant. That's because data will show an email was opened, but not known if it was opened by intended recipient. So now what?

Over the course of the last several months, greater emphasis has been put on measuring clicks within an email, or the calls to action. That data is still trackable.

Just recently released by Litmus was a report about getting a better understanding of email in a digital world more focused on privacy. The report is called "Email Analytics in 2022" (Download it here).

What did Litmus find in its report?

Before MPP went into effect in September 2021, 64% of marketers were concerned with the impact it would have on their email analytics and means of measuring campaigns; 43% were planning to change how they measure email performance; 26% weren't sure.

In April 2022, Litmus reports 53% of Apple Mail has been impacted by MPP. Data such as significant increases in open rates are among the results marketers are seeing. Litmus said Gmail is prefetching images as well, adding to the uncertain reliability (or lack of it) regarding open rates.

So how do you adjust?

  • Re-evaluate your email strategy.
  • Re-evaluate your email marketing goals.
  • Re-evaluate your email templates.
  • Re-evaluate what's important to your business.
Here are some metrics Litmus suggests as potential new email analysis metrics:
  • Email read rate. This depends on your email tool. But having an email open read equals eight seconds.
  • Click-through rate.
  • Unsubscribe rate.
  • Bounce rate.
  • Spam compliant rate.
  • Conversion rate.

Monday, April 11, 2022

TikTok leads the way in Q1 2022

TikTok's growth is something we haven't seen since Facebook's introduction nearly 20 years ago. It doesn't appear to be slowing down anytime soon.

The latest app rankings data from Sensor Tower, TikTok was once again the most downloaded app in Q1 2022, beating out a handful of Meta-owned apps.

The report, which is called "Global App Revenue Growth Was Flat in Q1 2022, While Usage Grew Nearly 5%," also revealed medical, navigation, travel, business, and shopping apps saw the most usage growth year-over-year in Q1 2022.


According to the report, "TikTok saw the most downloads across both marketplaces combined as well as on Apple’s platform, while Meta maintained its grasp on the top of the Google Play chart. In 2021, Facebook was the most downloaded app on Google Play, while this past quarter, that distinction went to Instagram, which saw 125.8 million first-time installs. Across the App Store and Google Play, TikTok saw more than 186 million installs globally."


Facebook/Meta still have a strong presence in the digital/social media world. However, some data is showing slowing growth and even decline in some areas.

The company's monthly active users data shows growth. But, as noted previously, the growth is showing.


Here's a concerning statistic for Facebook/Meta. For the first time, there was a decline in daily active users. Facebook did add users in the Asia Pacific and European regions, but overall, it lost a million actives.


It's early to tell what that potentially means for the company. But, it does show users are open to going to different apps to engage on social media. For the full report, click here.

While revenue stayed relatively flat, there is still high revenue in apps and social media.

According to the report, "
TikTok, including Douyin on iOS in China (the Chinese version of TikTok), maintained its position as the top grossing non-game app overall as well as on the App Store. Across both stores, TikTok generated $821 million in consumer spending this quarter. On Google Play, it came second to Google One, which topped the chart with nearly $250 million."


Thursday, April 7, 2022

TikTok launches marketing education tool


TikTok has launched a tool to help marketers understand and utilize the various platform features to reach and engage the TikTok audience.

Called Creative Agency Partnerships University, the program will guide agencies and freelancers through all aspects of effective TikTok creation.

TikTok continues to grow at a rapid pace. Therefore it's necessary for companies, brands and the like to continue to pay close attention to TikTok and see if it is the right platform to reach their audience. When that decision is made, it'll be a learning curve. The goal for this latest tool from TikTok is to flatten the curve and simplify the app for all users.

The new program will be another way to brush up on your TikTok knowledge, with input from the platform’s creative team.

Monday, April 4, 2022

What are your site's keywords?

Sticking out in a crowded space is hard. There's no denying that. But it's not impossible.

Keywords are an important piece of any search engine optimization, or SEO, puzzle. However, a word to the wise says what you think are the keywords for your organization or business may not what searchers think. Therefore, it's important to see what queries searchers are using and how your website lands within that search.

Here is a great tool to help you with that. It's called an Ngram chart. To check it out, click here.

This is what it looks like after you've completed your keyword research.


This chart shows keywords in search queries that garnered the best position and clicks for your company/organization. The bigger the block, the more often the term appeared in a search with your company/organization as a result.

How do you find this out?

First is you log into your Google Search Console.

Once on the home page of GSC, go to "performance" on the left-hand side.


Set date range for "past 12 months."

You'll see your results below. Go to the upper right-hand corner and click on "export". For this example, click to download to Excel.


Open the downloaded file. There you will see all the search queries where your company/organization appeared as a result in the previous 12 months. If you click on the other tabs, you'll get other great information such as URLs, countries, etc.

The next step is now think of what you think the keywords are for your business or organization. In this example, it's for an organization that specializes in disability support services. So, I'll use disability as a keyword here.

So go to the filters across the top and click on the "+". It'll open a filter menu. Click on "query".


 Then click on "queries containing." Then type in the keyword you'd like to explore.


You'll get the results of all queries that contain that query. Then export the file like you did earlier.

Open the newly downloaded Excel file. Then highlight and copy all the queries data (including clicks, CTR, position). Once copied, paste them to the bottom of the first search queries document you created.


Repeat this process but change the queries filter to "queries not containing."


Export this new file and open the newly downloaded Excel file. Then highlight and copy all the queries data (including clicks, CTR, position). Once copied, paste them to the bottom of the first search queries document you created.

Then open the Ngram website: https://seodataviz.com/ngram.php#

Once on the site, click "clear form" for each section. Copy all the keyword queries from the initial Excel document and paste them into the top window.


Change the settings at the above to 4 for Min Ngram Occurance and 2 for Min Term Length. Click "submit."


You now have your keyword data chart!


You can hover over each term and gives you data about the search query, such as the percentage it's used.

You can also download the data and it'll give a numerical value for that query. The higher the value, the more relevant the query is in terms of a keyword.

Monday, March 28, 2022

LinkedIn updating Campaign Manager experience


LinkedIn is growing in many areas, including individual users and companies using it as a job recruitment tool.

Thus, LinkedIn is updating its Campaign Manager navigation experience in an efforts "to help advertisers be more efficient," according to its website.

"The new left-hand navigation offers a more organized, simplified experience that makes it easier to find the campaign and account elements needed to run successful campaigns," according to LinkedIn's website.

"The new navigation also makes it easier to switch between multiple ad accounts."

LinkedIn does caution users that the update is being gradually rolled out so not all users have access to it as of right now.

To showcase LinkedIn's growth, here are some statistics from omnicoreagency.com:

  • 19.2% of Millennials (18-24 years old) use LinkedIn. 
  • The age group with the most LinkedIn users is between the ages of 25 and 34 at 60.1%
  • 50% of internet users with a college degree or higher use LinkedIn.
  • The average income of a LinkedIn user currently stands at $46,644 per year.
  • 51% of US College Graduates use LinkedIn.
  • In 2010, there were 78 million LinkedIn users. At the end of 2020, there were 690 million users.
  • LinkedIn is the top network for B2B content marketers for organic social marketing at 96%.
  • 80% of B2B leads come from LinkedIn.
  • In 2017, there were 17 million companies using LinkedIn. At the end of 2020, it was 50 million.

Friday, March 25, 2022

Instagram announces algorithm-free feed


Social media is taking a shift toward the old days.

On March 23, Instagram announced it is providing Favorites and Following option with users' news feeds, which goes away from the often-controversial algorithm method.

"Today, we’re introducing Favorites and Following, two new ways to choose what you see in your feed," according to the announcement on Instagram's blog. "We want you to be able to shape Instagram into the best possible experience, and giving you ways to quickly see what you’re most interested in is an important step in that direction."

In the early days of social media, back in the early- to mid-2000s, news feeds were organized in chronological order based on when your friends posted.

As social media evolved, the concept of organizing feeds based on users' behaviors - i.e. algorithms - came to light.

In that time, especially over the last couple years, that practice has become highly controversial and has seen its fair share of challenges in court. The latter was evidenced by the Facebook whistleblower standing before the U.S. government revealing many of Facebook's secret in how the social media giant "organizes" content.

So, what are Favorites and Following?

According to Instagram, "Your Instagram feed is a mix of photos and videos from people you follow, suggested posts and more. Over time, we’re going to add more recommendations to your feed based on your interests — Favorites and Following are new ways to catch up on recent posts from the accounts you follow.

"Favorites shows you the latest from accounts that you choose, like your best friends and favorite creators. In addition to this view, posts from accounts in Favorites will also show up higher in your home feed.

"Following shows you posts from the people you follow. Both Favorites and Following will show you posts in chronological order, so you can quickly catch up on recent posts.

Click here to read the full blog and how to use the latest feature from Instagram.

Friday, March 18, 2022

Universal Analytics to go away in 2023


Well, we've known for a while about the fading and eventual disappearance of third-party cookies. Now, Google has announced its plans to filter out Universal Analytics or GA-3 by mid-2023.

In a blog post, Google announced, "All standard Universal Analytics properties will stop processing new hits on July 1, 2023.

"Given the new Analytics 360 experience was recently introduced, Universal Analytics 360 properties will receive an additional three months of new hit processing, ending on October 1, 2023."

Here is more from that blog post:

"In today's measurement landscape, businesses need to navigate new challenges to understand the complex, multi-platform journeys of their customers — all while prioritizing user privacy.

"Two and a half years ago, we introduced Google Analytics 4 to address these evolving measurement standards and help businesses succeed. Google Analytics 4 has the flexibility to measure many different kinds of data, delivering a strong analytics experience that’s designed for the future. It allows businesses to see unified user journeys across their websites and apps, use Google’s machine learning technology to surface and predict new insights, and most importantly, it’s built to keep up with a changing ecosystem."

What will happen is new data will continue to process on GA-3 or UA until July 1, 2023. After that, no new data will be tracked or stored. So, technically, you have until June 30, 2023, to learn and transition to GA-4. However, historical data on UA will disappear. So, in order to build year-to-year, month-to-month data, it's suggested you transition into GA-4 as soon as possible. That way you have historical data to work from.

To read more about it, Prepare for the future with Google Analytics 4, click here.

Thursday, March 17, 2022

What's trending on Twitter


Twitter has released an in-depth report, saying it analyzed "billions of tweets" over a two-year period to "find three must-know trends about to go big."

You can download the report "Twitter Trends 2022" by clicking here.

The three trends revealed by Twitter are:

  • The Great Restoration. Healing the planet by healing ourselves.
  • Fan-Built World. Digital communities call the shots.
  • Finance Goes Social. Investing has entered the chat.
Let's first look at the first bullet point, The Great Restoration.

It's been two years (Yes! Two years!) since COVID-19 was declared a pandemic. Among the many things that have happened as a result of the pandemic, focusing on mental and overall health has become more important than what it used to be.

Another part to this aspect is a greater emphasis on the overall planet's wellbeing, such as recycling. What this means is businesses need to be assertive, take action.

Next, lets explore bullet point No. 2.

Another result from the pandemic is the massive reliance on digital. Therefore, consumers are taking a firmer control of the market. They're setting the communities that are engaged online. Businesses now have to adapt to that and work their way into those communities.

From the report, "Celebrate the people and communities who love you and find new ways to build them up and bring them close."

Lastly, lets explore bullet point No. 3.

The report states, tweets about finance is up 78 percent year-over-year. This trend "is more than viral stock picks, though. The finance conversation has become part entertainment, part gaming, unapologetically social, and more open than ever before."

For example, tweets talking about Bitcoin and the like are on the rise.

Meta/Facebook launches Business Academy

If you manage a business page on Meta/Facebook, you might have noticed a new option: Business Academy.


As you can see with the image, it's a tool being offered to page moderators aimed at helping them learn more about the Meta/Facebook Business page and how to grow its presence.

It features several modules that go over winning customers, growing a business, keeping customers and automating messages.


With these modules are several lessons, such as the one below under "keep customers."


Monday, March 7, 2022

Google working toward business trust

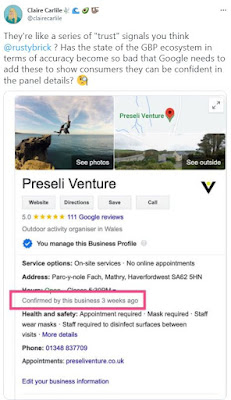
Rolling out slowly is a new Google Business Profile verification label. The "label" will highlight businesses they've been verified by Google as an actual business and how recently it was verified. 

Claire Carlile, a local SEO expert for BrightLocal, sent a tweet March 3 highlighting the change with GBP.

In an article by BrightLocal, Fraudulent Business Profiles in the Spotlight as Google Updates Verification Requirements and Trust Signals, one of the reasons for this change is to show which businesses have verified their information and how recently. The purpose is to build trust with the consumer that a website they may be about ready to click on is a legit website for a legit business. A business that isn't verified or not verified in a respectable time period, may be a deterrant for online users.

"Unfortunately, there’s currently no way to request that Google contacts you to confirm your details," the article says. "It appears that the only way to influence this label appearing on your GBP is ensuring you answer the phone call if you do receive one, and, of course, appropriately confirming your details during the call. However, whether the label is then assigned to you or not is still naturally at Google’s discretion."

The linked article above goes over steps on how to get verified a GBP page verified by Google..

But, in short, it's always a good idea to make sure your information is up to date in GBP. 

Like previously mentioned, the linked article above helps understand the procedure for the verification process. But here is a snippet that is important to understand.

"If you’re a legitimate business, then you’ve no reason to be concerned about the potential for double verification," the article says. "Should this be asked of you, all you need to do is follow the instructions provided and submit the required information.

"A more stringent verification process could help to reduce fake listings in the Local Pack, Local Finder, and Google Maps—which is great news for authentic businesses. 

"If you’re a marketer working with local businesses, then you’ll want to make your clients aware that additional verification may be required. Ensuring that their contact details and other information is accurate now could help to avoid problems with this in the future."

Friday, March 4, 2022

Invited to University of Wisconsin career presentation


I'm excited to share that I've been invited to be a guest presenter at the Wisconsin School of Business’ Sobic Career Workshop: Building Industry Confidence and Connections through Sales Techniques on Friday, April 22.

The workshop will be led by Professor Kevin Chung and Professor Ishita Chakraborty from the Department of Marketing. The event is designed to help students develop the skills necessary to be successful in the sales industry, while building upon their industry knowledge through networking and learning from employers in sales. Students will hear from keynote speaker, Dan Sobic, participate in a networking lunch, and actively engage in three small group learning sessions with employers.

I'm honored to participate in this event.

NICHOLAS DETTMANN'S ARCHIVES

Blog Archive